Having issues running a game on the Deck? You might need to do some digging in the logs!
There’s a couple options to have a log file created on the Steam Deck.
PROTON_LOG=1
Our first options is Proton Log. It seems that this only works with certain versions of proton.
First, open up the Properties menu of the game you are debugging. Then type in:
PROTON_LOG=1 %command%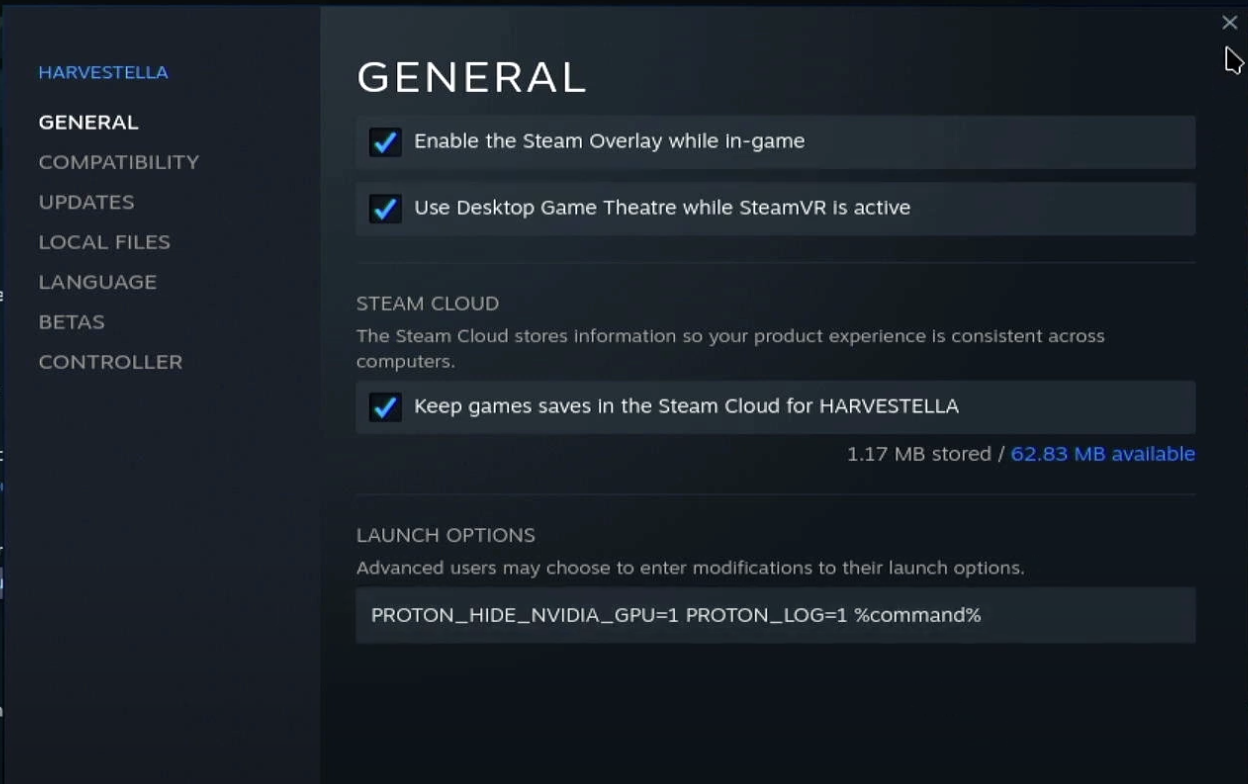
Close the menu and launch your game.
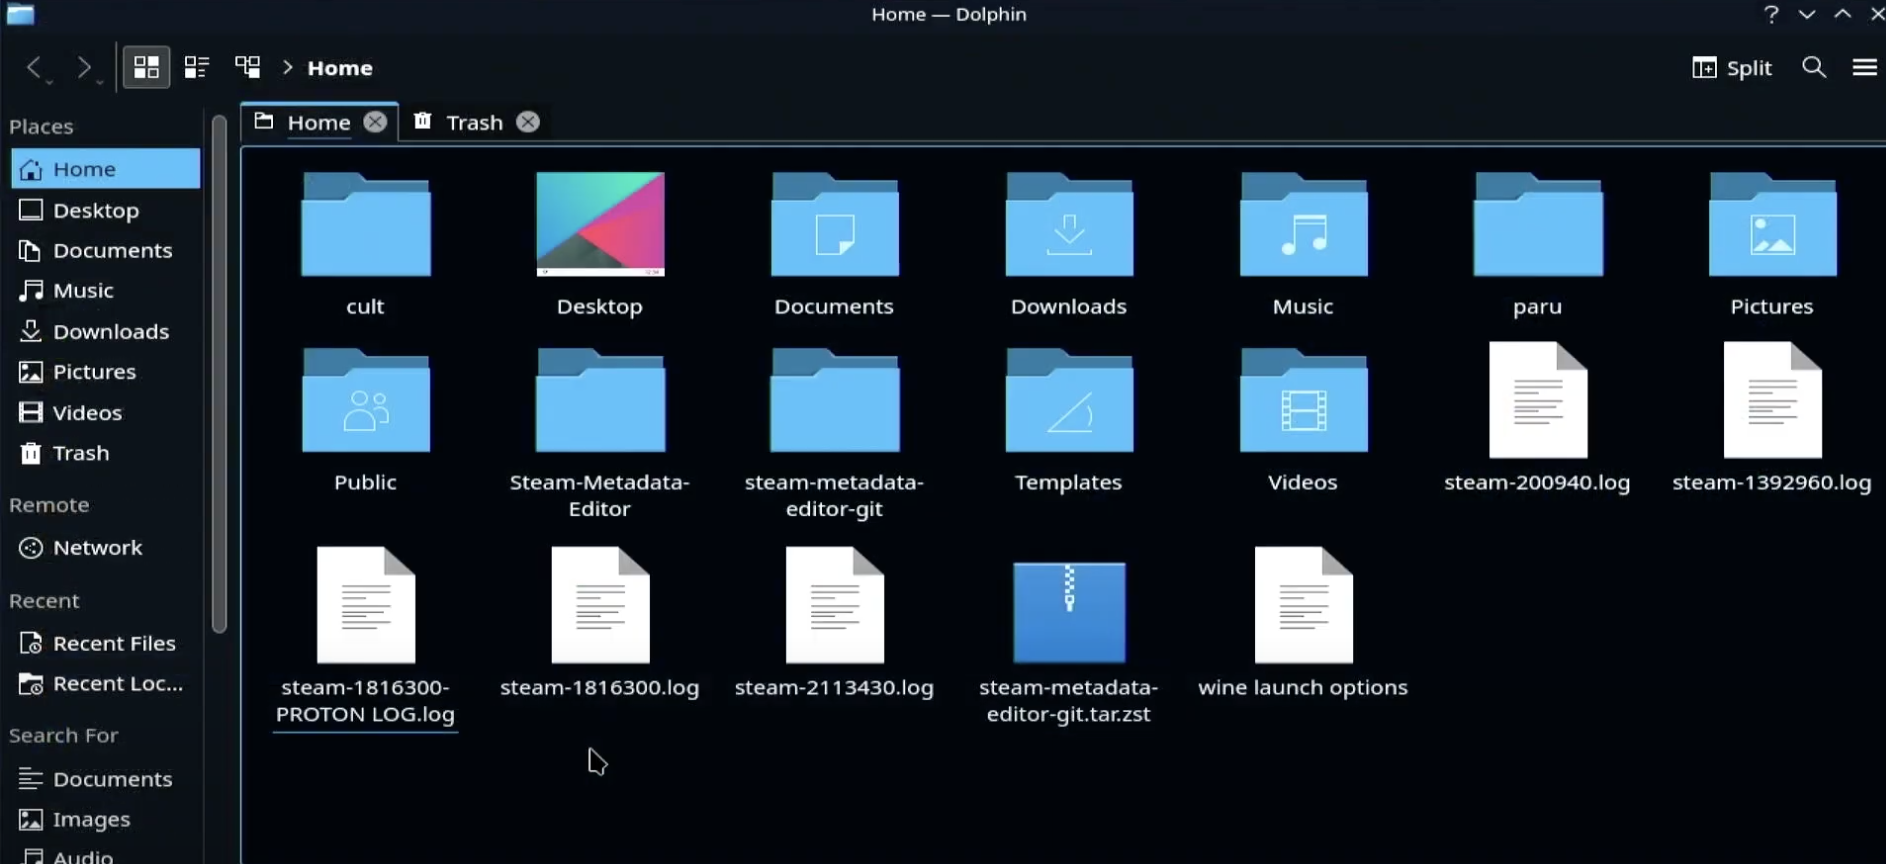
Now, open up Dolphin and you should seen in your home menu a file called “steam-{app id}.log”
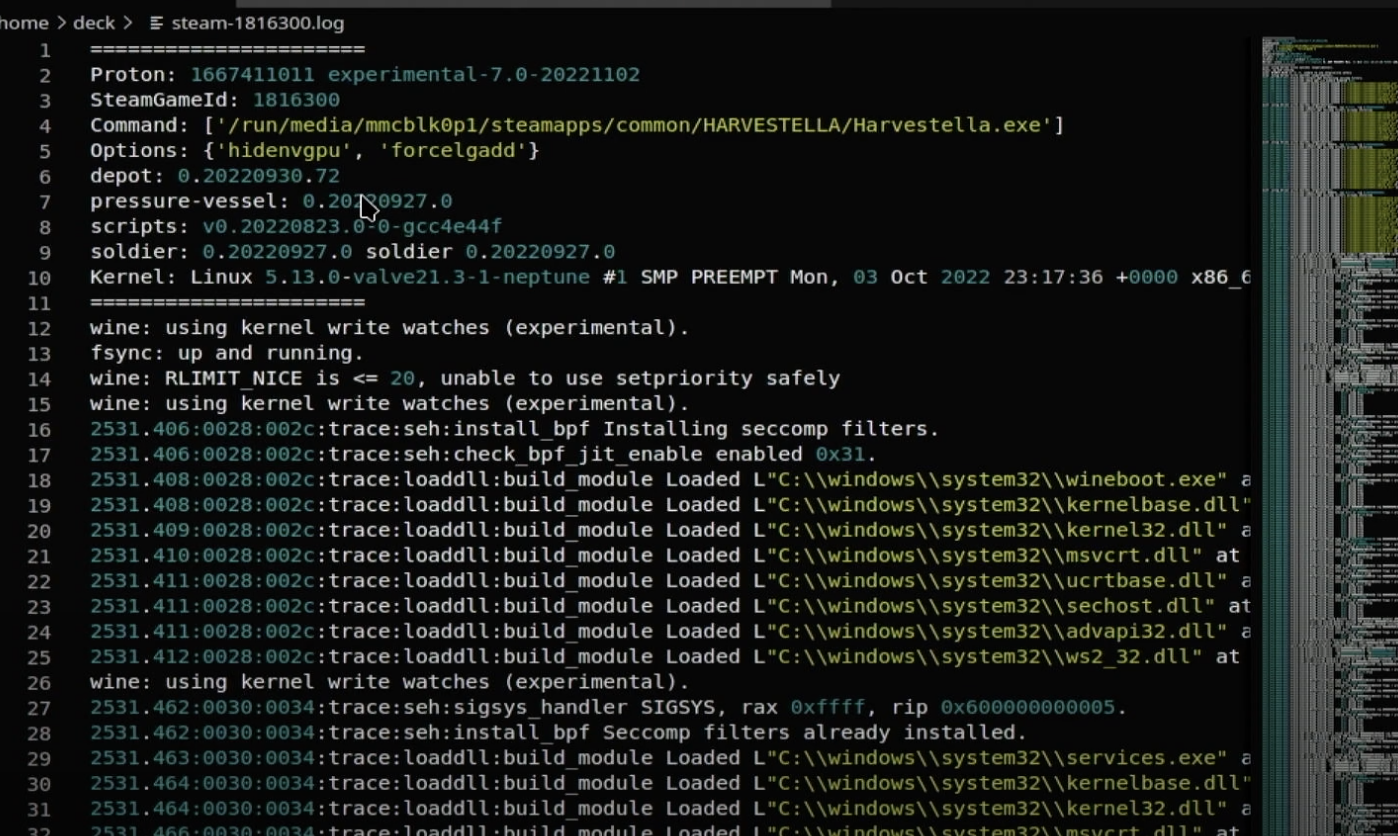
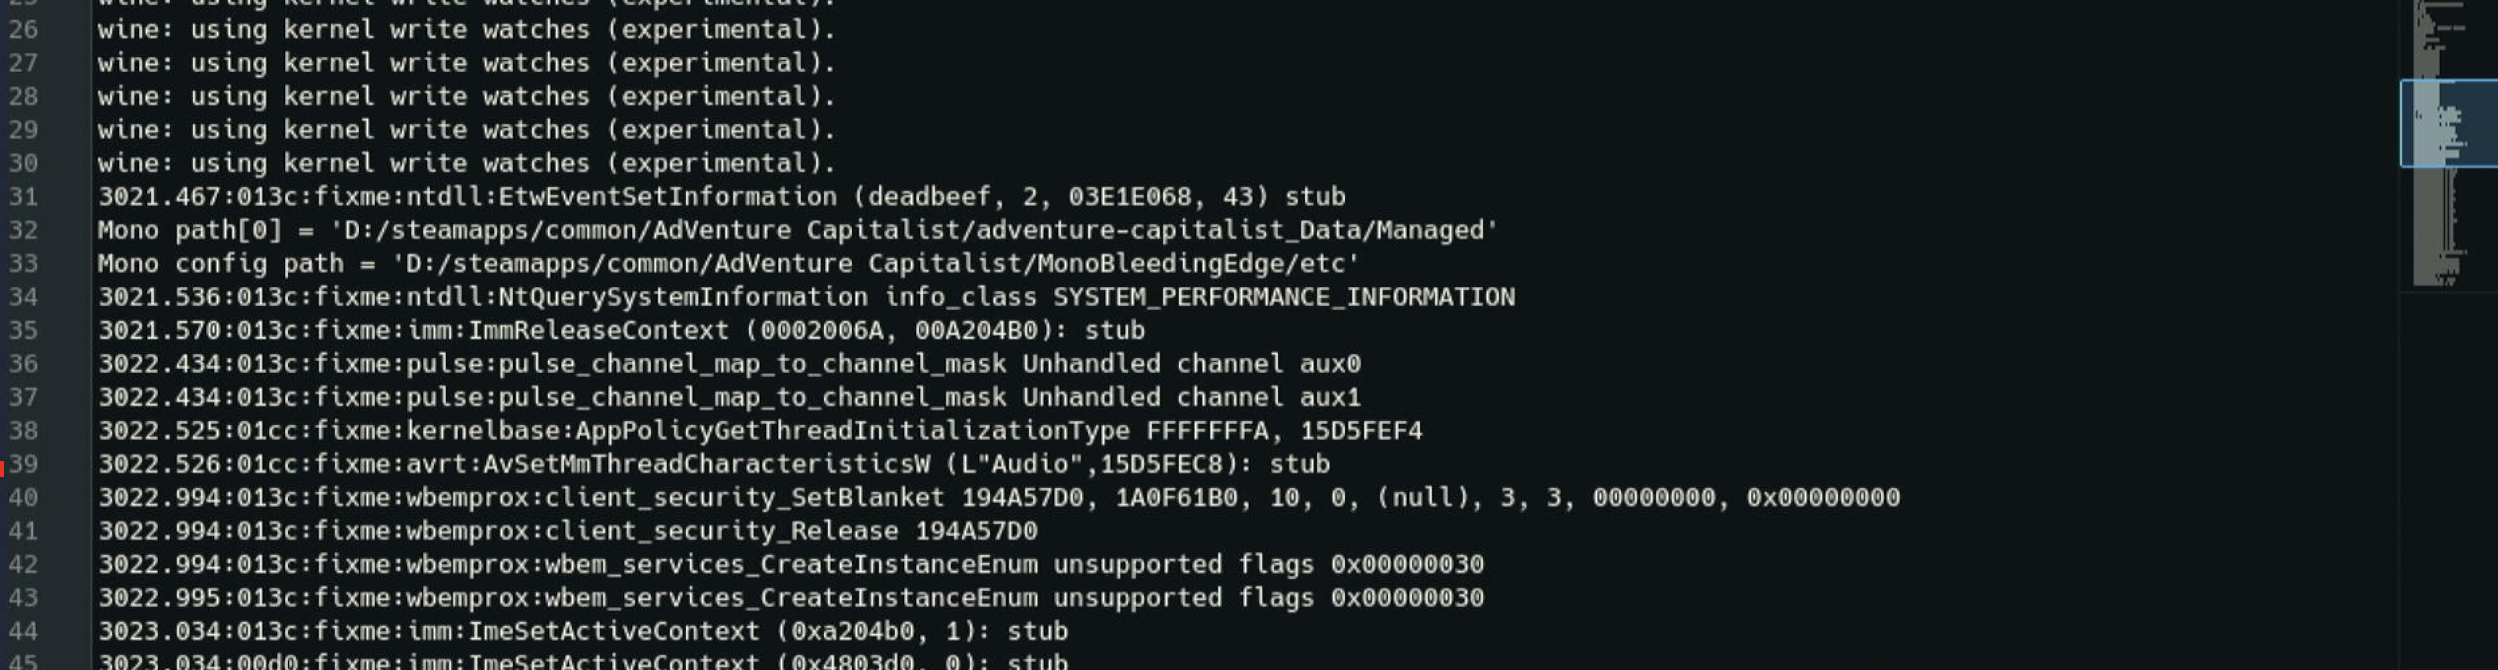
Open this file in your preferred editor and browse away!
WINEDEBUG=” “
Wine debug has quite a few more options. We’ll do the same first steps of opening Properties and adding our command. The .log file will be stored with the same “steam-{app id}.log” name.

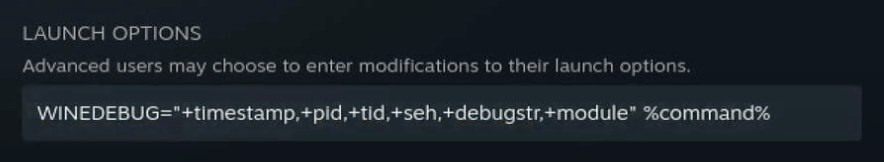
There are a lot of debug channels that you can select from to decide what you want to be displayed in the log file. You can mix and match, or use +all if you want to generate the biggest debug final known to man.
Useful Channels:
+all
I will not be showing you an example of +all because I have a 64gb Steam Deck and not enough space for a file that big 🙂
+all : logs everything, probably gives too much information in most cases, but may come in handy for subtle issues
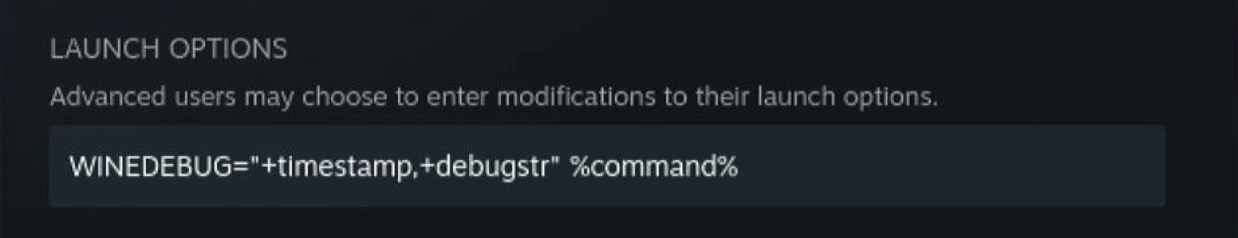
+debugstr
+heap
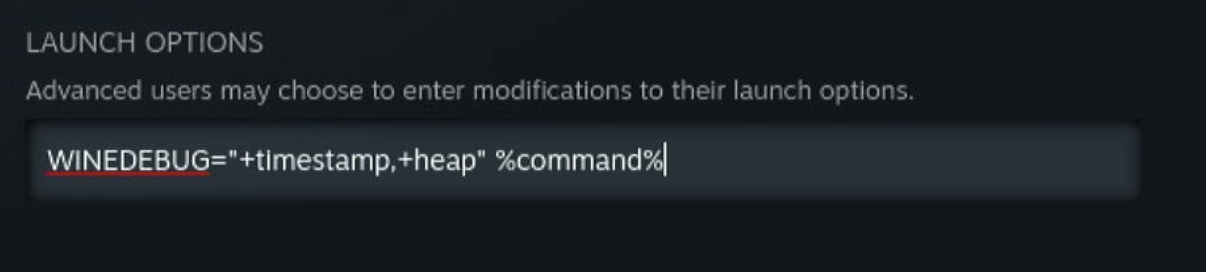
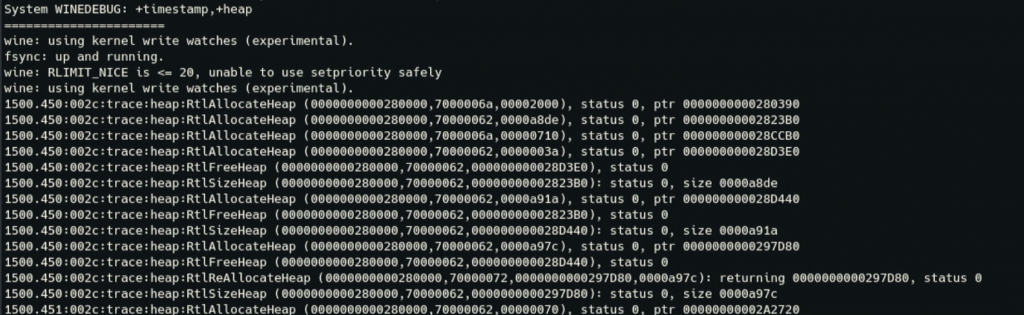
+heap : traces all heap activity in the program and switches on constant integrity checks. If an app is trashing the heap, doing a +relay,+heap trace will let you narrow down exactly where it’s happening. If an inconsistency is detected, Wine will dump the contents of the heap and terminate the program. Although many things can lead to trashing the heap, the most common is Wine overrunning an internal buffer. Be sure to remember this channel; all Wine code uses the HeapAlloc/HeapFree APIs internally, and a primary reason is that Wine’s built in heap debugging is so useful. Be warned that +heap can make a program extremely slow, and generate very large log files. If you’re concerned that Wine may be corrupting the heap but are not sure, warn+heap will enable heap validation but will not trace every allocation and free.
+loaddll
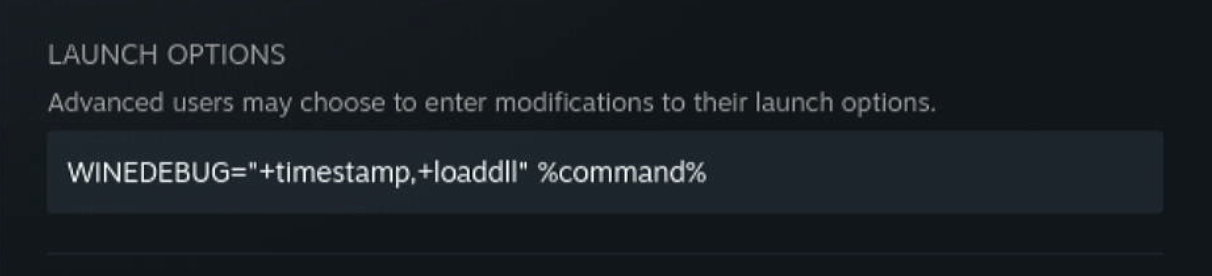
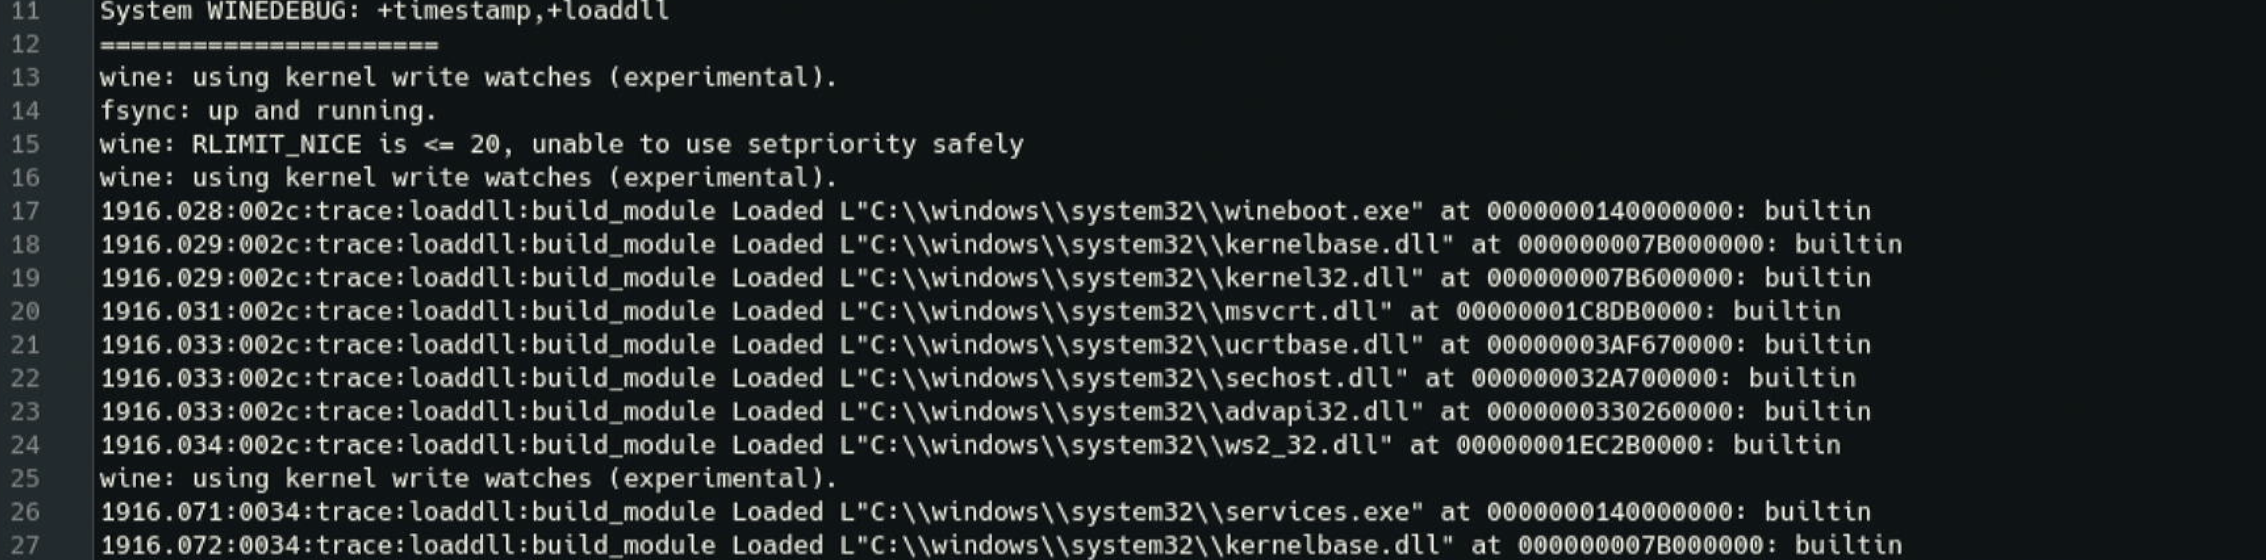
+loaddll : reports each DLL as it is loaded.
+message


+message : logs all window messages dispatched to the window procedure, in a manner similar to +relay. Use +msg to trace calls to individual messaging-related APIs.
+msgbox : logs the contents of any calls to MessageBox(). Many programs display crash information using MessageBox(), so this can be a quick way to gather that information in a usable form.
+pid : prefixes each debug output line with the ID of the process that generated it. This can be helpful when debugging multiprocess applications.
+relay
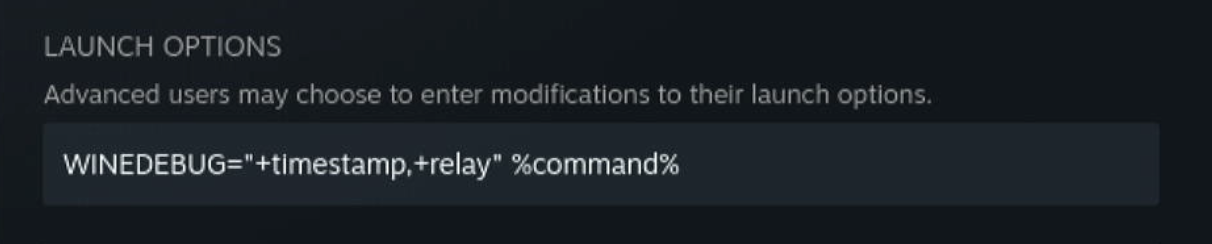

+relay : logs every call that crosses the DLL boundary of Wine’s built-in modules, including calls between (non-native) DLLs. This channel is often the first port of call when you have no idea what’s going wrong. It shows you each call into and out of Wine modules at the DLL boundaries. If you’re being overwhelmed by certain functions, look into setting the RelayInclude and RelayExclude strings in the Wine registry (under [HKCU\Software\Wine\Debug]). Note that this string is already pre-populated with some functions which are frequently called but don’t usually give any clues as to why a program might be failing. Never use +relay or +snoop with native DLLs! This will show you the implementation of those DLLs, which means that any code you write to implement them violates our clean room reverse-engineering rules.
.seh

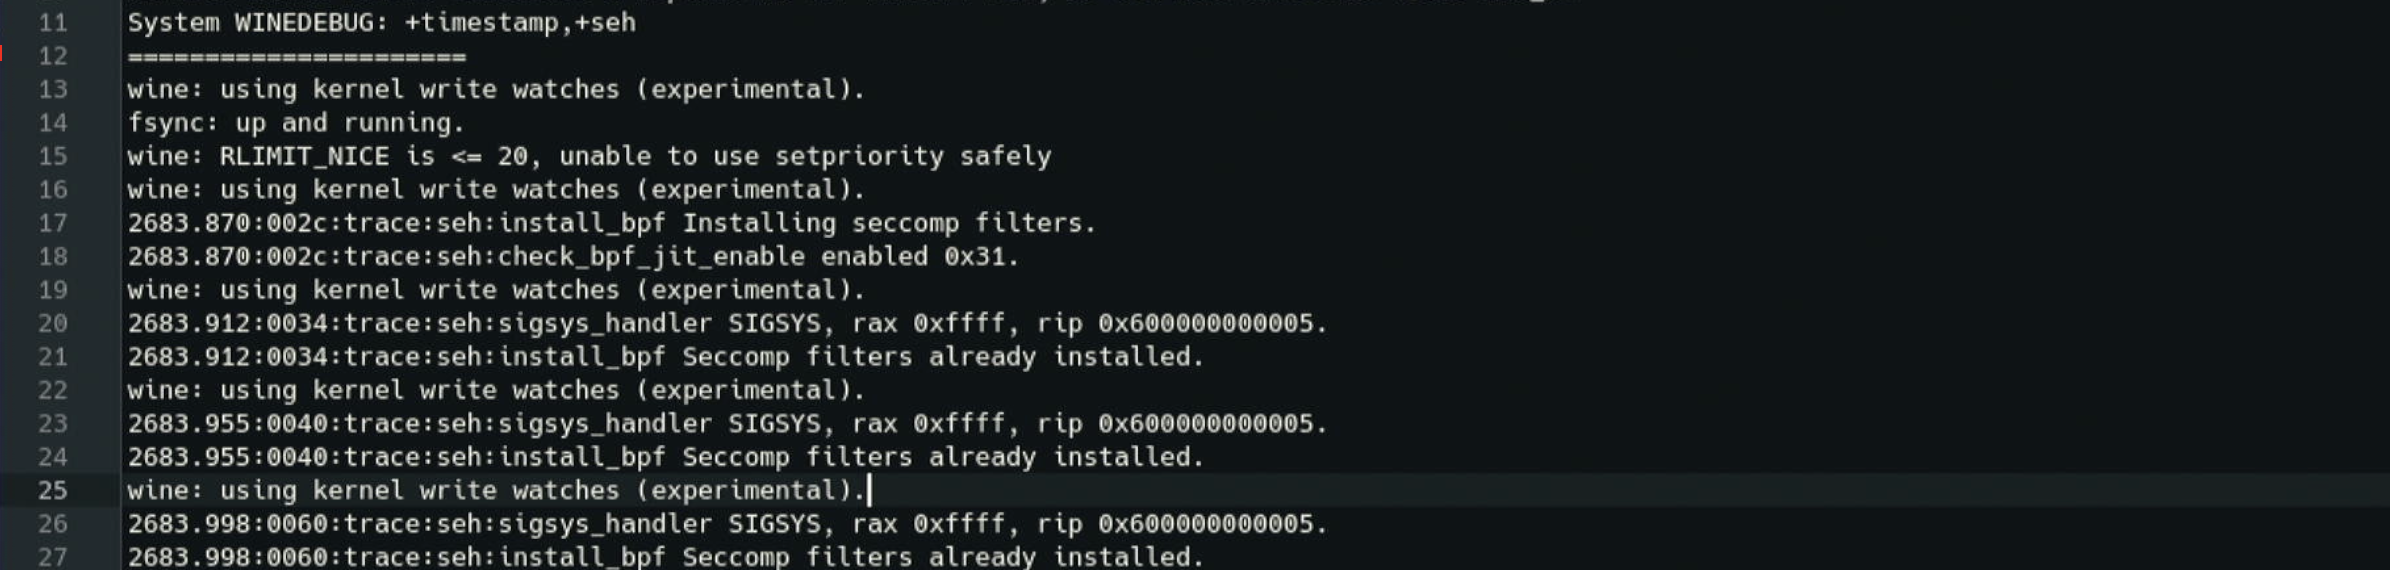
+seh : logs Windows exceptions (Structured Exception Handling). These are invoked either when an application performs an illegal operation (i.e. crashes), or if a program throws its own exceptions. Wine converts UNIX signals into SEH exceptions and outputs them using this channel. This can be useful because applications will often trap their own crash, in order to perform an emergency save for instance. The most common exception to watch for is STATUS_ACCESS_VIOLATION or 0xC0000005 which is the closest equivalent in Win32 to a segfault. You may also see codes which don’t appear in the headers; these are typically language-specific exceptions used by whichever compiler was used to produce the EXE. E.g. 0xEEDFADE is the code for a Delphi internal exception, and 0xE06D7363 is a Microsoft Visual C++ exception, which has a magic value (info[0]) of 0x19930520, which is easy to remember because it looks like a date (and probably is). If you see any of these exceptions, it may mean a Win32 API call returned a non-zero error code somewhere.
+server : shows each wineserver RPC. You don’t normally need this but it may prove helpful when debugging wineserver issues.
+snoop : logs every function call between native DLLs. This is similar to +relay but works between two native DLLs, although this channel provides poorer information because parameters aren’t reported. +snoop may also break or destabilize an application as it inspects the stack and disassembles function prologues to try and guess parameters. Never use +relay or +snoop with native DLLs! This will show you the implementation of those DLLs, which means that any code you write to implement them violates our clean room reverse-engineering rules.
+synchronous : forces X11 into synchronous mode
+timestamp: prefixes each debug output line with the timestamp when that line executed. This is invaluable for debugging performance issue.
+fps: prints the number of frames per second in the terminal for OpenGL, D3D, or Vulkan applications.